Visualize your Automatic Customer segments and RFM segments and see how customers flow from segment to segment over-time.
Learn how those customers behave and advice on how to market to them.
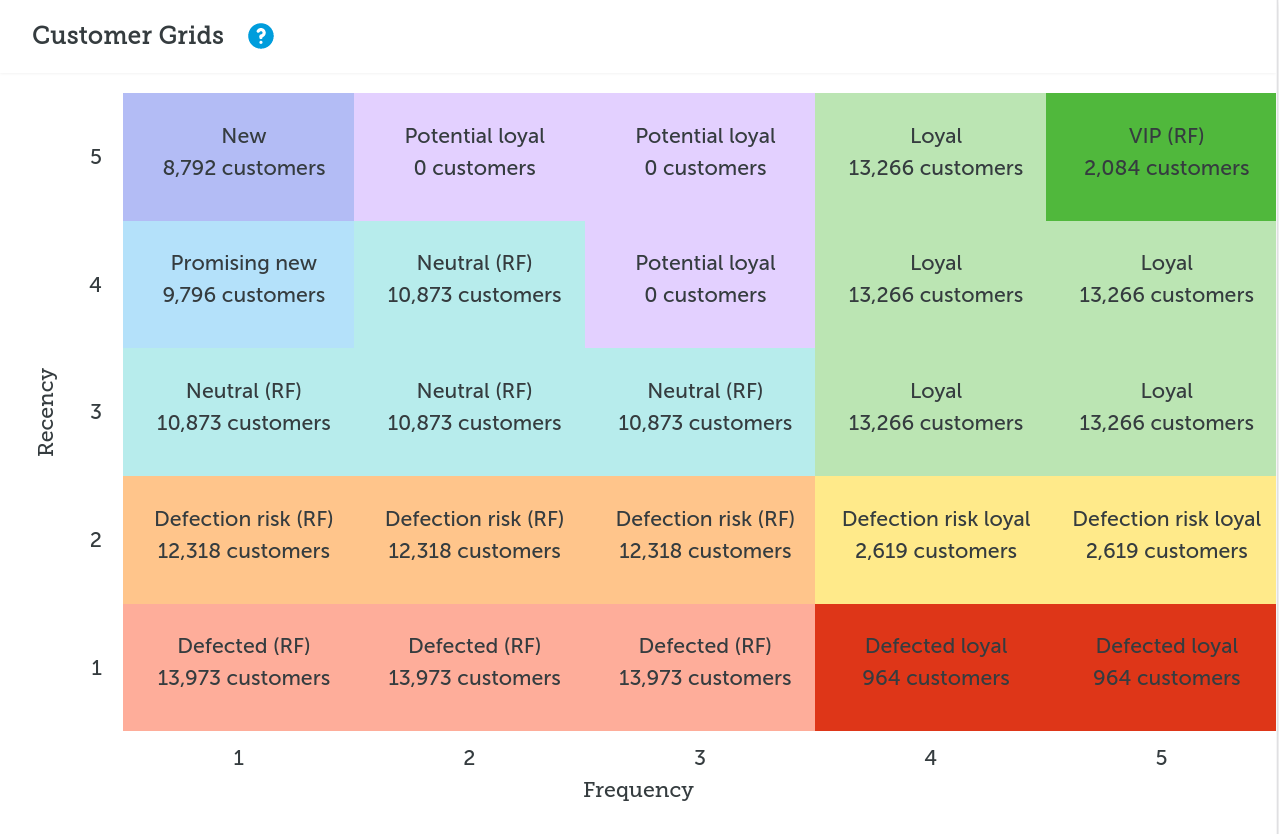
Visualize your customer segments

- Distills the 125 RFM scores into an easier to understand 2D Customer Grid
- Combines similar behaviors into common segments
Three Customer Grids to measure different behaviors

- Recency-Frequency: for customer loyalty based on when and how many times a customer ordered
- Frequency-Monetary: to see which customer spend more or less on their average orders and identify Whale customers
- Recency-Monetary: detect customer loyalty and defection based on their order sizes
Historic Grids show customer development

- Compare how the Grids evolve over-time to see customers develop
- See which segments are growing and shrinking
- Spot migrations of customers from segment to segment caused by shifting of their behavior
Repeat Customer Insights