Analyze customers with the cohort analysis to learn how their acquisition date influences their buying behavior.
Learn how their buying lifecycle changes from month-to-month and when they disappear.
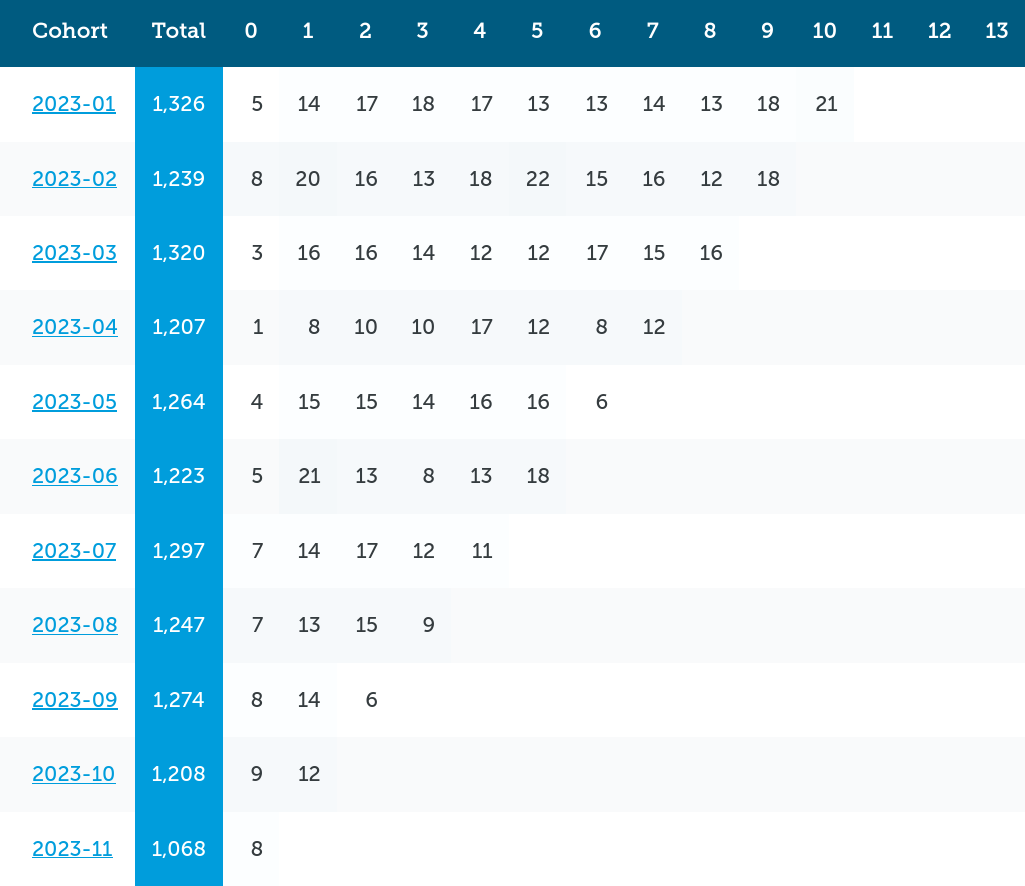
Automatic Cohort Analysis

- Segment customers into their initial cohort month automatically
- Track cohort buying behavior for their entire lifetime, even years after their first order
Measure behavior from month-to-month

Measure how customer behavior changes for each cohort from month to month.
- How many customers ordered
- How many orders were placed
- Revenue totals
- Average Order Value
Graph key cohort metrics

Graphs of the cohort metrics can make trends and outliers easier to spot. Find problems and opportunties so you can adjust your marketing in time.
Drill-down into details on each cohort

- Track the important metrics for each cohort (Revenue, Average Order Value, Repeat Purchase Rate)
- Compare which sources you acquired the customers from
- Month-by-month details of their metrics
- Graphs of the cohort metrics over their lifetime
Repeat Customer Insights