Looking at the new Winter Holiday dashboard in Repeat Customer Insights there's a lot of potential information you can use to improve your holiday. I'm going to use the data from the demo:
(Even if you don't have the app, this process of figuring out the story your metrics are telling could be used anywhere)
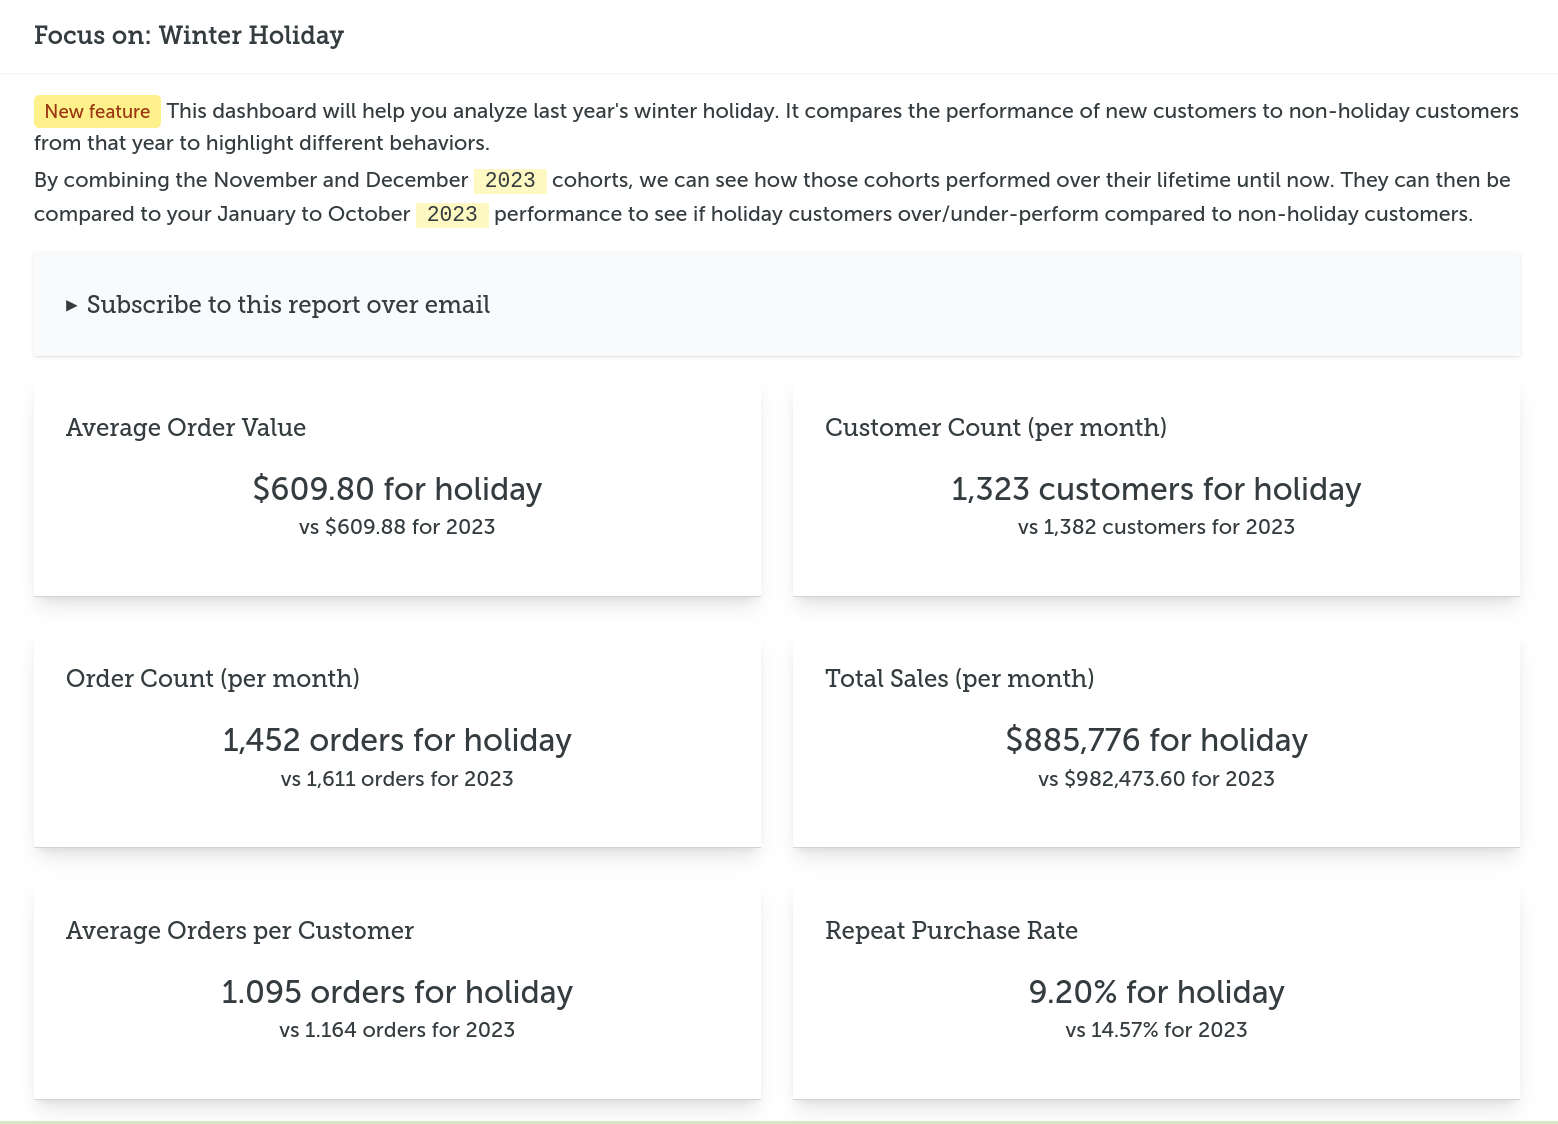
Remember, the "holiday" version means for November and December cohorts while the 2023 are the remaining months of that year. As I write this, it's August so those holiday cohorts should have aged enough to show any repeat customer loyalty behavior by now.
First off we see Average Order Value is about the same. That tells us the order sizes of holiday customers are consistent with regular customers. There's little showing large orders only in the holiday or shrinking repeat orders later in their lifecycle.
That also means any formula that uses AOV can be applied during the holiday.
Next in Customer Count per month we can see there's a small drop in the number of customers who first order in the holiday compared to the rest of the year. So no big holiday bump for acquisitions.
(This is unusual for standard cycle ecommerce stores but it's actually caused by the random demo data that doesn't have a seasonality built-in. Your data will tell a different story.)
Next Orders Count per month is much lower for holiday customers (10% lower). This would be a sign they are weaker repeat customers than customers acquired the rest of the year.
Total Sales per month is also lower which makes sense. Less orders but the same order size (AOV) would cause Total Sales to be lower.
Similarly Average Orders per Customer is a bit lower which relates to the Order Count issue.
Finally the metric that ties it all together, Repeat Purchase Rate, is much lower for holiday customers. Those customers just aren't buying again as often
Given those last four metrics, the story I see here is holiday customers spend the same per order but they tend to not order as frequently over the next year. This causes them to spend less, have less orders, etc.
A lot of decisions could come from this but two could be:
-
Large discounts in the holiday might attract customers who demand discounts on all orders. They ended up spending the same amount (after discount) as regular customers, but aren't enticed to buy at off-holiday times.
-
The weaker metrics for holiday customers will depress how much should be spent to acquire them. With about 10% less orders and total sales, your budget per customer acquisition should be at least 10% less to make the same profit. If you have tight margins, you could actually be overspending and acquiring customer who you never profit from.
Now as I mentioned, this demo data is fake random data so your actual conclusions might be different. If this was your store though, this information would be vital to know about before you develop your plans for the winter holidays. Maybe switch to a free gift with purchase model instead of discounting and try to invest in organic traffic sources before November arrives. Knowing this in summer gives you plenty of time to have a better Q4.
If you want to see what advice Repeat Customer Insights has for your store, you can install it and let it analyze your data.
Eric Davis
Measure your customer loyalty
Measure the different levels of customer loyalty with Repeat Customer Insights. It uses various models to segment and grade your customers based on their behavior.