Alfons was asking about how the cumulative cohort option in Repeat Customer Insights works.
When you enable Include Previous Months (cumulative), each column adds the ones from the left so there's a running total.
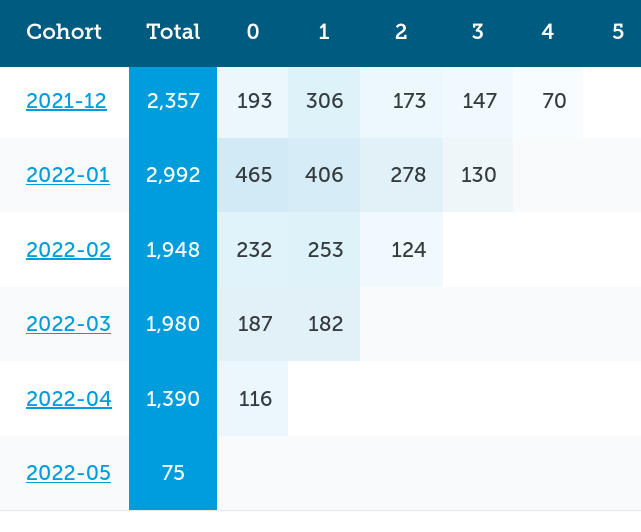
For example, lets use the regular cohort analysis. If you look on the row 2022-01, when Include Previous Months is off you'll see:
- 465 customers ordered again in 2022-01 (column 0)
- 406 customers ordered in 2022-02 (column 1)
- 278 customers ordered in 2022-03 (column 2)
Turning on Include Previous Months the values change to:
- 869 customers ordered in 2022-01 (column 0) same
- 406 customers ordered in 2022-02 (column 1) same, it's the first real month so no previous months to rollup
- 612 customers ordered in 2022-03 (column 2), different. There's 406 customers who ordered in the last month (column 1) plus 206 new ones this month
Each view of the data gives you different analyses depending on what you're looking for. Looking at both, you can also spot some things that neither view would tell you directly.
The cumulative view let's you see how many customers ordered at least a second time since the first month they ordered.
(There's also a Revenue-based cohort view in the app that works similarly except it tracks the total revenue spent for each cohort in each month)
Eric Davis
Learn what your customers are actually doing instead of just guessing
One of the best ways to build a sustainable business starts by getting your customers to come back. Mastering that simple process can be difficult, but builds a lifelong business.
Repeat Customer Insights can help you understand your customer's behavior. With its collection of behavior reports, you can see what they're actually doing instead of guessing and having your efforts fall flat.