Part of my work on Repeat Customer Insights is evaluating broader industry statistics and incorporating them into the app as part of the advice and Insights components.
Many customer loyalty industry statistics come from a large Adobe Digital Index study done in 2012. While useful, much has changed since then and Adobe's target stores are different than Shopify stores.
That prompted me to perform my own small-scale study to analyze the performance of actual Shopify stores. My hope was to confirm Adobe's numbers or find more relevant ones to use in my advice and in the app.
Scope of analysis
The analysis was performed on over 1,500 Shopify stores. Stores without data, with incomplete data, fake stores, and testing stores were removed from the analysis where possible.
The analysis was done on non-personally identifiable aggregate data and no AI was used. (It's just basic math and statistics, no need to involve the robots)
Metric: Repeat Purchase Rate
Adobe's study is vague on Repeat Purchase Rate but does use 27% as the number of one-time customers who come back. This would be Repeat Purchase Rate of the first-to-second order.
Analyzing the Shopify stores I found the average full Repeat Purchase Rate to be 25%. The median was 22.5% which tells me there's a few stores on the higher end of the range dragging the average up.
Interestingly the standard deviation was 14.6% which tells me most (~68%) of the stores had Repeat Purchase Rates of about 10% to 40%.
This is measuring the full Repeat Purchase Rate, meaning across all sequenced orders. Adobe's measures only the first order which is typically the lowest rate, later orders would typically show a higher rate.
This data showing a result lower than Adobe is useful for two reasons:
- Even this 2% difference can have long-lasting impacts on long-term revenue.
- Since Adobe only measured the 1st rate, the full value is likely a lot higher. That would extend the 2% gap between Shopify stores and Adobe's stores. (See how my app does order sequencing to better understand the first-to-second vs full values)
This starts to highlight the idea that Shopify stores need help with repeat customers, especially when compared to the larger brands sampled in Adobe's study.
Metric: Average Order Value
Average Order Value is often mentioned as one of the key metrics in ecommerce.
Shopify and Repeat Customer Insight supports stores in many countries and using different currencies. These five currencies had enough stores using them to be useful for my analysis:
- AUD
- EUR
- GBP
- INR
- USD
Adobe's study listed $116 (USD) and €107-€137 (EUR, country dependent) as the Average Order Value of their stores.
For each currency I calculated the Average (mean) Order Value and Median Order Value using the raw order amounts. This made sure I avoided averaging the average which would allow outliers to extremely bias the results. For example I found one store with just over 100 orders but an Average Order Value of over $14,000.
| Currency | Median Order Value | Average Order Value |
|---|---|---|
| AUD | $109.05 | $146.76 |
| EUR | €52.74 | €68.18 |
| GBP | £41.11 | £54.78 |
| INR | ₹1287.95 | ₹1698.02 |
| USD | $68.51 | $98.33 |
This analysis draws some interesting conclusions.
In every case the median is lower than the average, often by about a 1/3rd. That's a sign there are higher outliers pulling up the average significantly (median is less prone to outliers).
When comparing to the Adobe measurement, the USD and EUR both report lower Average Order Values. Adobe didn't publish their medians unfortunately so it cannot be compared. I would suspect their median was similarly lower than their average.
These differences probably come from Adobe measuring the largest stores while Shopify stores tend to be smaller.
These also tell me that the new measured Average Order Value rates should be used as benchmarks for Shopify stores, even if just to keep up with the rest of the stores on Shopify.
Metric: Average Orders per Customer
While not covered in the Adobe data, knowing how many orders a customer places on average is a very useful planning metric.
Close to one order per customer and you'll have almost no repeat customers. Above two and you'll likely have a decent portion of repeat customers.
For the Shopify stores this came out to 1.8 orders per customer when using the full data.
Interestingly, calculating it per-shop and measuring the median I get 1.45 orders with a standard deviation of 5.
As seen with previous metrics, this shows some shops have high enough values to pull up the averages.
In either case, the Average Orders per Customer in these Shopify stores is good but definitely room for improvement.
Graph: Number of orders vs total revenue
Next I wanted to graph the number of orders against the total revenue (USD-only). As these are the components used in Average Order Value, they should be correlated across the stores.
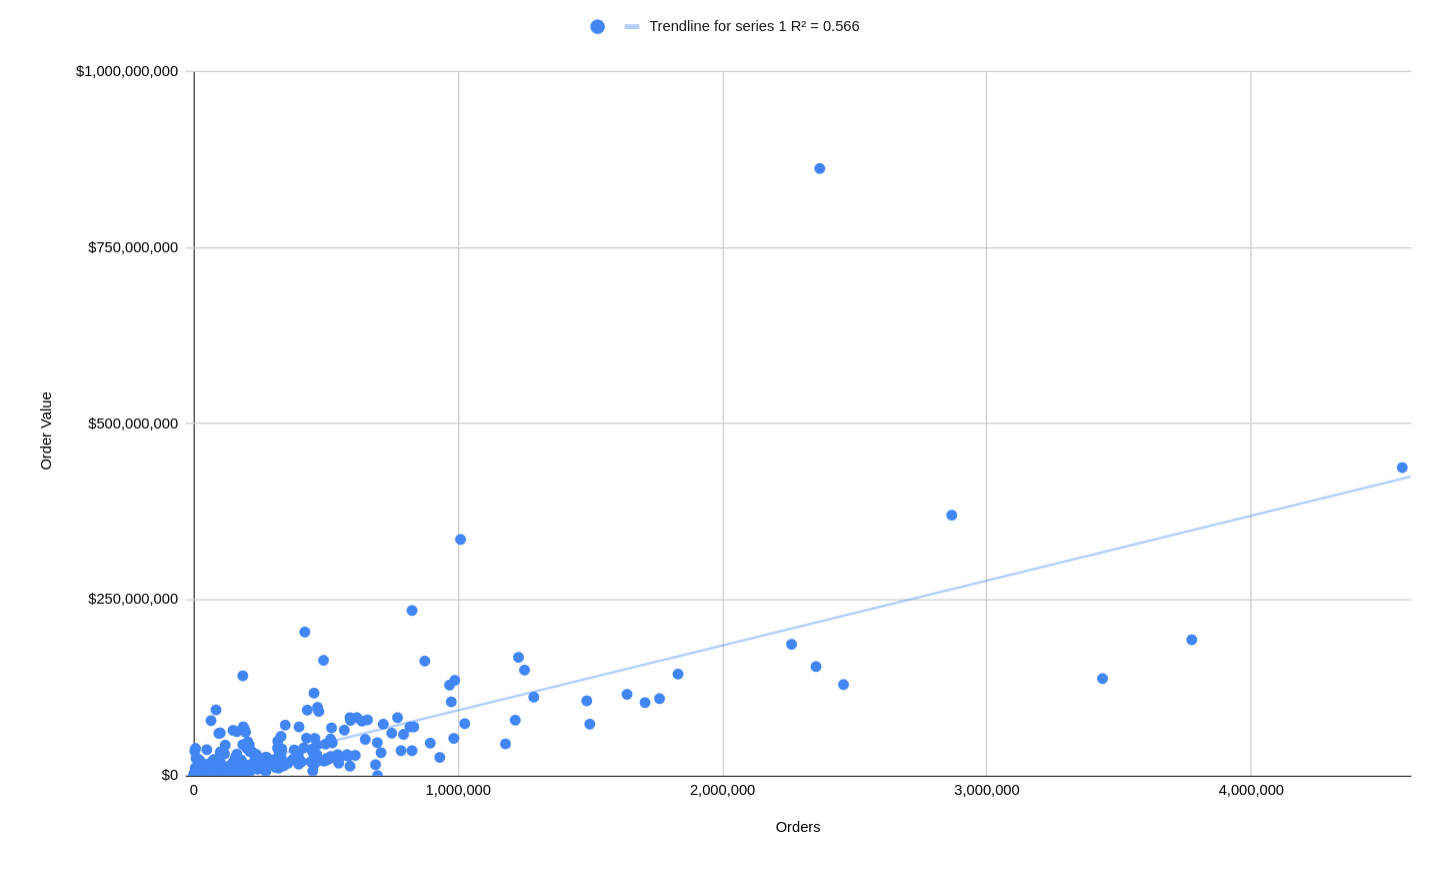
As expected, as the number of orders increased the total revenue increased. No surprises here.
Graph: One-time vs repeat customers
Similarly I wanted to see how the number of one-time customers compared to the number of repeat customers.
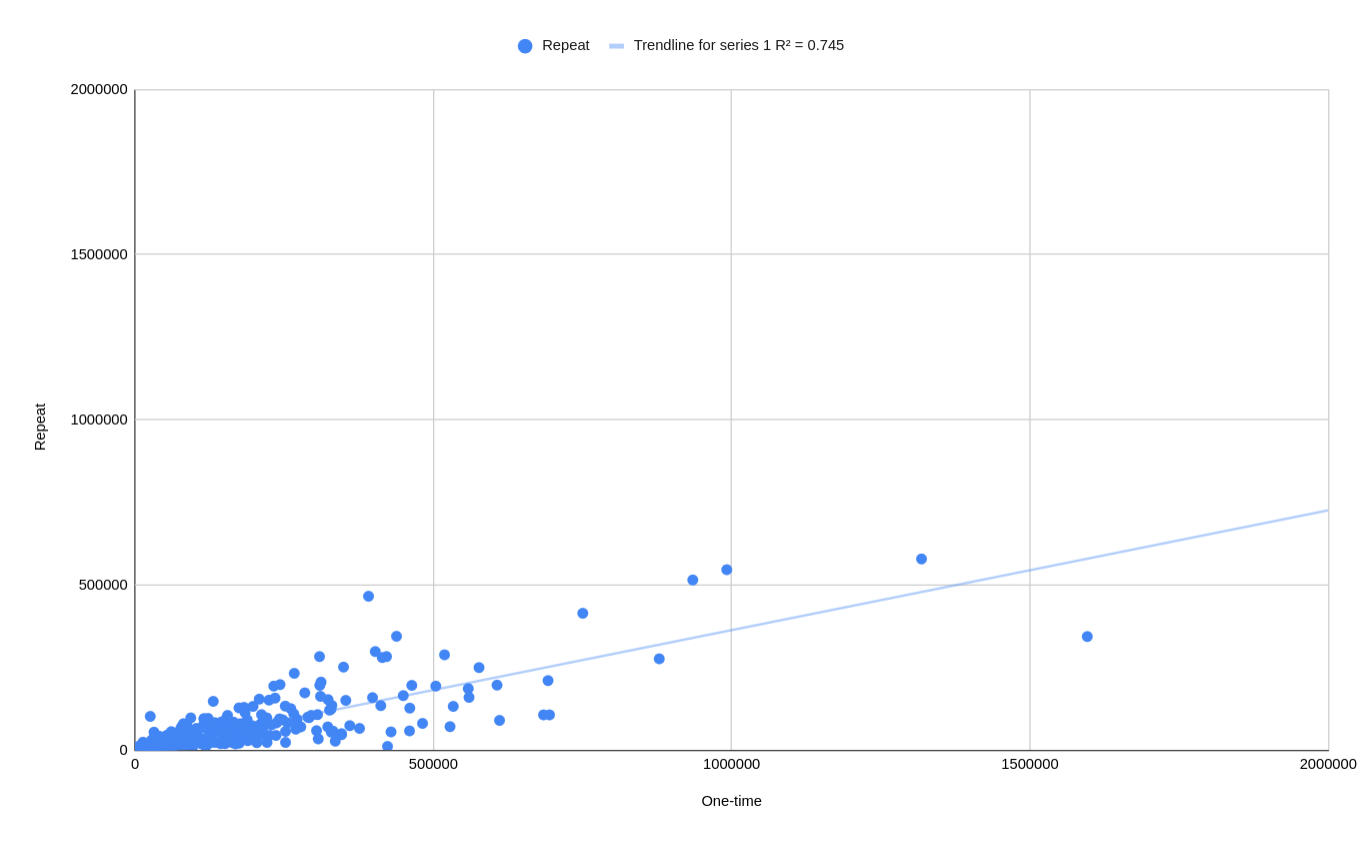
As expected, the one-time customers outweighed the repeat customers 3:1, right near the Repeat Purchase Rate.
Some outliers had a much closer ratio meaning their repeat customers were a larger proportion that usual. My guess is they used subscriptions or had a consumable product that would encourage repeat orders (like many CPG stores).
Graph: Repeat Purchase Rate vs total revenue
Next I wanted to see if the Repeat Purchase Rate and total revenue were correlated at all (USD-only). I would think the more repeat orders the higher the revenue.
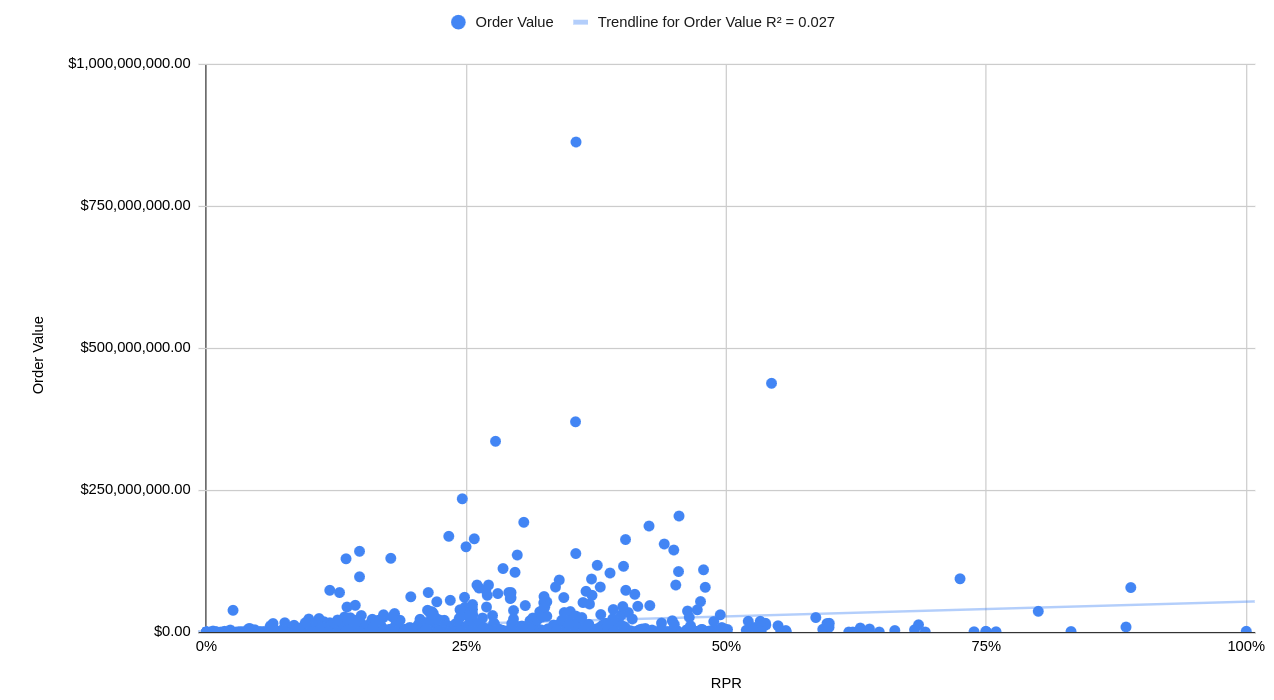
In this case the values were all over the place. Some stores showed correlation but many didn't. A trend-line showed a R-squared value of 0.027 meaning the data varied too much to conclude any correlation.
This could be explained by the low overall Repeat Purchase Rates as discovered above. If so, that means Shopify stores could be doing much more to encourage repeat orders (which actually follows research I've done that lead to the development of Repeat Customer Insights).
Graph: Average Order Value vs total revenue
Since "increase your Average Order Value" is often mentioned advice for growth, I wanted to see if higher AOVs were actually happening at higher revenue levels.
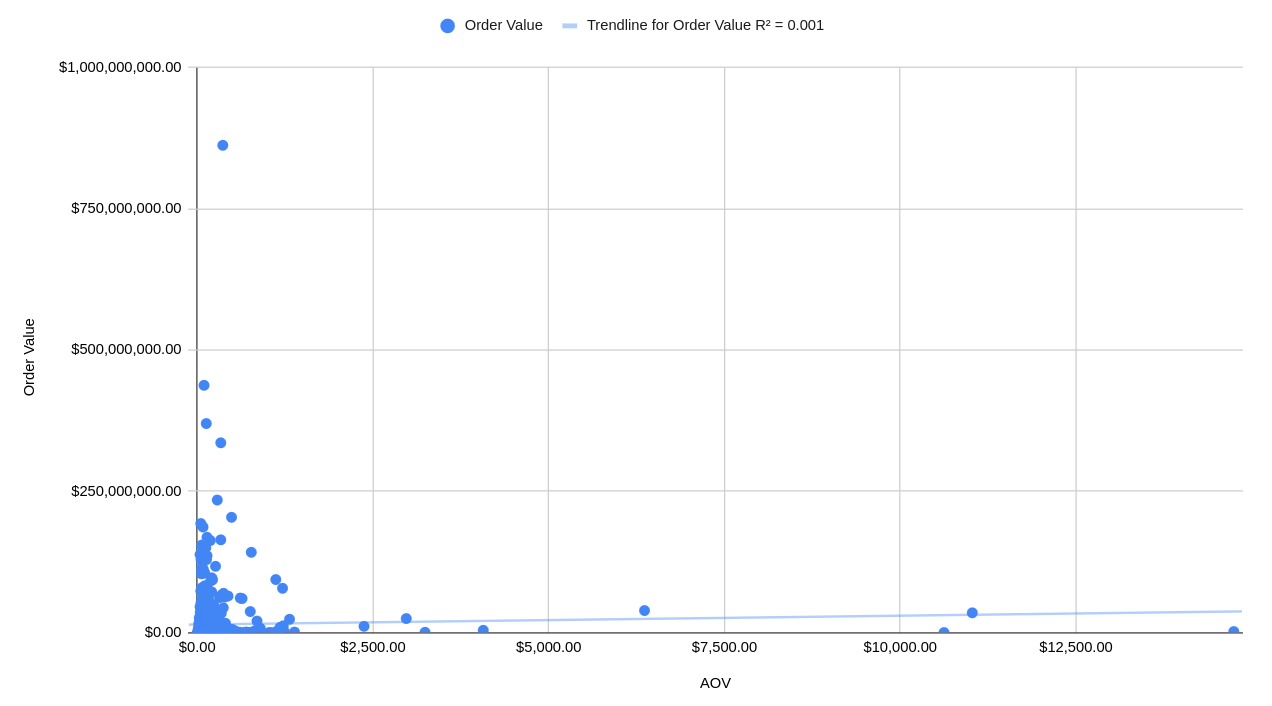
The USD data couldn't support that claim. The largest AOVs were on shops with smaller total revenues. The stores with the most total revenue had above-average AOVs in some cases but more like double or triple ($200-300) and not anywhere near the higher numbers. Some shops with the highest total revenue where even right around the averages ($90s).
That tells me there is an upper bounds on how much you can grow your Average Order Value if you're trying to grow your total revenue. Any further growth needs to come from more orders. Either new customer acquisition or repeat customers reordering.
Conclusions
Since the goal of the study to was see how actual metrics from Shopify stores compared to the Adobe study, the study was successful.
Most metrics measured were close to Adobe once you factor in inflation over the decade. There's also probably a bias for larger stores to be included in Adobe's study.
A concern arose through for Shopify stores and their repeat orders. My hypothesis for years was that Shopify stores struggle to attract customers back at the same level as larger, brand-name stores. This leads to either depressed total revenue or a reliance on more customer acquisition (at the cost of profit).
That was proven out based on the Repeat Purchase Rates measured.
Part of this could be from an over-reliance on Shopify's built-in reporting and analytical options. Shopify has multiple, high-powered features and reports to support customer acquisition and order transactions but very little to support repeat customer and loyalty growth. That lack of built-in information might lead some stores to ignore customer retention in favor of more-easily accessible acquisition reports.
That lack of reporting is why I decided to build Repeat Customer Insights so this study ended up supporting what I noticed years ago.
If you're a store owner or in charge you should definitely review how your store compares to the metrics reported in here. Customers using my app will see these metrics incorporated into the app in the coming future.
Eric Davis
Segment your customers to find the diamonds in the rough
Not all customers are equal but it is difficult to dig through all of your data to find the best customers.
Repeat Customer Insights will automatically analyze your Shopify customers to find the best ones. With over 150 segments applied automatically, it gives your store the analytics power of the big stores but without requiring a data scientist on staff.